Install the app
How to install the app on iOS
Follow along with the video below to see how to install our site as a web app on your home screen.
Anmerkung: This feature may not be available in some browsers.
Du verwendest einen veralteten Browser. Es ist möglich, dass diese oder andere Websites nicht korrekt angezeigt werden.
Du solltest ein Upgrade durchführen oder ein alternativer Browser verwenden.
Du solltest ein Upgrade durchführen oder ein alternativer Browser verwenden.
Infos über Airports weltweit
- Themenstarter Donnergeräusch
- Beginndatum
munich
Schneekönig
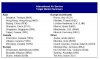
Hier schon mal die Juni-Rangliste (nur für die beiden Tokyo-Airports liegen derzeit noch keine Zahlen vor und somit ist deren Rang hochgerechnet)
Juni vorläufig
1 Atlanta, GA (ATL) 7.595.161
2 Chicago, IL (ORD) 7.061.930
3 London, GB (LHR) 5.935.129
4 Los Angeles, CA (LAX) 5.559.109
5 Dallas/ft Worth Airport, TX (DFW) 5.398.638
6 Tokyo, JP (HND) 4.844.750 (Nachtrag 24.9.)
7 Paris, FR (CDG) 4.513.500
8 Frankfurt, DE (FRA) 4.465.308
9 Denver, CO (DEN) 4.260.361
10 Amsterdam, NL (AMS) 3.810.764
11 Las Vegas, NV (LAS) 3.533.118
12 Phoenix, AZ (PHX) 3.430.314
13 Minneapolis/St Paul, MN (MSP) 3.389.513
14 Madrid, ES (MAD) 3.388.744
15 New York, NY (JFK) 3.320.270
16 Houston, TX (IAH) 3.285.558
17 Detroit, MI (DTW) 3.176.271
18 San Francisco, CA (SFO) 3.169.196
19 Hong Kong (HKG) 3.089.000
20 London, GB (LGW) 3.079.521
21 Newark, NJ (EWR) 2.903.038
22 Bangkok, TH (BKK) 2.782.074
23 Seattle/Tacoma, WA (SEA) 2.753.282
24 Beijing, CN (PEK) 2.704.944
25 Orlando, FL (MCO) 2.700.901
26 Tokyo, JP (NRT) 2.582.742 (Nachtrag 24.9.)
27 Singapore, SG (SIN) 2.603.192
28 Philadelphia, PA (PHL) 2.579.711
29 Miami, FL (MIA) 2.546.606
30 Rome, IT (FCO) 2.481.026
31 Toronto, OT, CA (YYZ) 2.461.567
32 Boston, MA (BOS) 2.412.345
33 Munich, DE (MUC) 2.352.474
34 Palma de Mallorca, ES (PMI) 2.330.419
35 Charlotte, NC (CLT) 2.237.254
36 Barcelona, ES (BCN) 2.219.267
Januar-Juni vorläufig
1 Atlanta, GA (ATL) 41.396.286
2 Chicago, IL (ORD) 36.391.038
3 London, GB (LHR) 32.254.174
4 Tokyo, JP (HND) 29 529 791 (Nachtrag 24.9.)
5 Los Angeles, CA (LAX) 29.362.911
6 Dallas/ft Worth Airport, TX (DFW) 29.261.888
7 Paris, FR (CDG) 24 377 551
8 Frankfurt, DE (FRA) 24.303.089
9 Denver, CO (DEN) 21.748.562
10 Las Vegas, NV (LAS) 20.359.945
11 Amsterdam, NL (AMS) 20.020.014
12 Phoenix, AZ (PHX) 19.527.071
13 Madrid, ES (MAD) 18.321.543
14 Minneapolis/St Paul, MN (MSP) 18.065.818
15 Bangkok, TH (BKK) 17.845.012
16 Houston, TX (IAH) 17.742.698
17 New York, NY (JFK) 17.617.838
18 Hong Kong (HKG) 17.062.000
19 Detroit, MI (DTW) 16.983.251
20 Orlando, FL (MCO) 16.054.655
21 San Francisco, CA (SFO) 15.838.327
22 Beijing, CN (PEK) 15.637.139
23 Miami, FL (MIA) 15.547.640
24 Newark, NJ (EWR) 15.386.508
25 Tokyo, JP (NRT) 14.685.620 (Nachtrag 24.9.)
26 Singapore, SG (SIN) 14.403.906
27 London, GB (LGW) 14.150.927
28 Toronto, OT, CA (YYZ) 13.433.120
29 Seattle/Tacoma, WA (SEA) 13.419.622
30 Sydney, AU (SYD) 13.416.093
31 Philadelphia, PA (PHL) 13.286.429
32 Rome, IT (FCO) 13.121.726
33 Munich, DE (MUC) 12.597.942
34 Boston, MA (BOS) 12.554.970
35 Charlotte, NC (CLT) 12.080.236
36 New York, NY (LGA) 11.686.560
37 Barcelona, ES (BCN) 11.568.445
munich
Schneekönig
Ähnlich knapp in der Weltrangliste wie das Rennen zwischen FRA und CDG ( wobei FRA heuer bedauerlicherweise verlieren dürfte) verläuft für MUC das Rennen mit BOS.
Dagegen dürfte das Rennen mit CLT und schon gleich gar mit ORY mit den heutigen Juli-Zahlen zu Gunsten MUC's entschieden sein.
--------------Juli 04 / Change / Jan.-Julí
CDG / 4.891.500 / +5,5% / 29.269.072
FRA / 4.752.525 / +5,62% / 29.055.614
MUC / 2.448.439 / +14,46% / 15.046.381
BOS / 2.489.024 / +14,24% / 15.043.994
CLT / 2.345.878 / +5,69% / 14.707.610
ORY / 2.343.200 / +9,7% / 14.037.900
Hier die soeben erschienenen July-Pax-Zahlen Europäischer Airports
und, soweit bekannt, die Paxzahlen Jan.-Juli 04 weltweit:
ATL 49.279.680
ORD 43.658.798
LHR 38.772.263
HND ?
LAX 35.351.180
DFW 34.939.042
CDG 29.269.172
FRA 29.055.614
DEN 24.948.312
AMS 24.365.074
LAS 24.059.387
PHX 3.591.777
MAD 21.995.235
MSP 21.557.149
JFK 21.388.104
IAH 21.327.849
BKK 21.102.134
HKG 20.613.000
DTW 20.346.444
SFO 19.176.396
MCO 18.920.118
PEK 18.811.620
EWR 18.446.513
MIA 18.392.996
LGW 17.599.843
NRT ?
SIN 17.083.013
SEA 16.428.084
YYZ ?
PHL 16.040.849
FCO 15.891.269
SYD 15.689.811
MUC 15.046.381
BOS 15.043.994
CGK ?
CLT 14.707.610
ORY 14.037.900
BCN 13.963.961
LGA 13.836.651
ICN 13.442.939
MAN 11.740.996
STN 11.702.460
PMI 11.253.275
MDW 11.742.020
MXP 10.418.789
ZRH 9.826.932
DUS 8.401.665
VIE 8.284.882
PS. Wurde von Marobo im airliners.de gerade darauf aufmerksam gemacht, dass das 2003 auch schon bis Juli so war!
CDG Juli 2003 / 4.615.600
FRA Juli 2003 / 4.499.816
CDG Jan.-Juli 2003 / 27.051.154
FRA Jan.-Juli 2003 / 26.963.300
Also besteht noch Hoffnung, dass FRA den 7. Platz wieder zurück erobert.
munich
Schneekönig
Hat jemand 'ne Ahnung, ob, bzw. was sich in PEK in den letzten 5-6 Jahren seitens des Airports getan hat (e.g. neue RWYs, Terminals etc)?
Wenn man sich mal die Pax-Zahlen von PEK ansieht
(1995) 15.875.218 - (1996) 16.383.225 - (1997) 16.907.954 - (1998) 17.318.999 - (1999) 18.190.852 - (2000) 21.691.077 - (2001) 24.176.495 - (2002) 27.159.665 - (2003) 24.363.860 und der heuer zu erwartenden 32-33 Mio, der allgemeinen Wirtschaftssituation in China und der Olympic Games 2008 scheint mir dringend der nachfolgende beschriebene Handlungsbedarf gegeben.
Auch was die Prognosen eines "Superhubs" angeht scheinen mir diese bei chinesischen Airports (in diesem Fall PEK) am ehesten zu zutreffen.
Thursday, September 9, 2004
Beijing's 2nd airport up in the air By Wang Yu and Jiang Yan
China Business Weekly
Beijing is very likely to build a second airport and possibly a third, according to government and airport officials.
The news comes hot on the heels of expansion at the Beijing Capital International Airport (BCIA), which began earlier this year.
"We are working on the project and will submit it to the State Council next month for approval," said an official at the Civil Aviation Administration of China. But he did confirm the building of a second airport was included in Beijing's overall city planning.
Passenger flow in the capital is expected to reach 120-150 million by the year 2020, he said. But BCIA can only handle 60 million, even after expansion. "We will have to build a second airport to accommodate the rest of the passengers," said the official, adding that it is also possible to set up a third airport for regional flights to shoulder some of the heavy air traffic flow.
Officials from the Capital Airports Holding Co (CAHC), the new airport's operator-to-be, also confirmed the news. "Beijing needs a second airport and we have assigned a special team to research and assess possible locations," said Li Peiying, CAHC's general manager, at a recent press conference to relaunch BCIA's first terminal.
"When the passenger flow of an airport exceeds 80 million, certain security concerns and air-traffic control problems arise," said Wang Jian, CAHC's public relations manager. He said that further expansion will incur significant costs as the areas around the existing airport have been developed and property prices are soaring.
"To choose a nearby city would be cost-effective, he said. "Langfang is a top candidate location we have always borne in mind." He said a qualified candidate location should be less polluted, with fewer natural disasters, and with a high operability of ground and air traffic.
Ren Xinhui, a professor at the Civil Aviation University of China, said that Langfang gets many votes because it is geographically and commercially qualified.
First, it is located in the north corner of the North China Plain, with either high mountains nor highrises, and it has high air-traffic visibility. It is well connected with Beijing by highways, and is only about 40 kilometres away from the capital city.
Second, it is less developed, and land prices are cheaper.
Feng Jie, a regional strategy expert with the State Council's
Development Research Centre, said that an airport located in Langfang would better integrate and facilitate the regional development of Beijing, Tianjin and their neighbouring provinces.
Wang declined to give the timing of the second-airport project: "We will not begin construction work until full use has been made of BCIA's expanded facilities."
The expansion of the current airport, approved last August by the State Council, began this March and is scheduled to be completed in 2007 in order to leave a one-year time period to test the newly built facilities.
"We must ensure the airport can operate smoothly to receive
international guests during the 2008 Beijing Olympic Games," Wang said.
After the expansion if the passenger flow keeps growing and the country's economy increases above 5 per cent annually, the construction of a second airport will possibly break the ground, he said.
"Fast and sustainable economic growth is very important to airport operators, because the operating costs are very high," he said. An investment loan of 20 billion (US$2.42 billion) can incur interest of 100 million (US$12.1 million). The total investment involved in the current airport expansion project will be 19.45 billion yuan (US$2.35 billion).
Currently, CAHC is making preliminary preparations. But it has neither assigned a commanding headquarters nor a project managing team. "We are just preparing for foul in fair weather," Wang said. "The company has some bit experience." He was referring to the ongoing expansion mainly for 2008 Olympic Games and the relaunching of the first terminal building urged on by soaring passenger flows in recent years.
Ren suggested relevant government departments and companies should begin considering details of the second-airport project -- now.
"BCIA, after expansion, will reach its handling capacity within 10 years," said Ren. "They should plan well in advance this time. If they have done last time, they did not have to rush to the expansion construction, and a better plan might be possible to cope with the 2008 Olympic Games."
There are currently two parallel runways and two terminal buildings at BCIA with an annual passenger flow capacity of 35 million. But during the peak month -- August -- of the 2008 Olympic Games, the passenger flow will reach 5.56 million, equivalent to a normal monthly flow in 2015.
Should we build a second airport or expand the existing one? Hot debates started in 2002.
"The expansion plan got approved mainly because we have to meet the demands of the Olympic Games first," said Zhao Minhe, a director with the civil aviation department under the China International Engineering Consulting Corp. "And we would first expand the existing airport into an international aviation hub." The company assessed the two possibilities and picked the expansion plan. "We will also help assess the second-airport project," Zhao said.
CAHC initially planned to expand the airport so that it could deal with a passenger flow of 72 million, reaching its capacity limit in 2020. But later it cut the capacity to 60 million, with an estimated full capacity date of 2015, according to a source close to the expansion plan.
"That is a consolidation and leaves room for a second airport," he said, and revealed that the construction may start in 2010 and finish in 2015.
BCIA's first terminal will be reopened later this month. After a
14-month renovation period, the building is to receive domestic arrivals with an annual passenger flow capacity of 9 million.
munich
Schneekönig
Vorläufige August-Zahlen einiger Spanischer und Englischer Airports. (Leichte Änderung vorbehalten, da diese Zahlen nicht nur den gewerblichen Verkehr beinhalten).
Erwartungsgemäß stark ist PMI und BCN (BCN lag auch letztes Jahr im August vor MUC und PMI natürlich sowoieso).
MAD 3.736.518 / +6,75
BCN 2.523.685 /+7,35 (MUC bräuchte +14,7% um vor BCN zu bleiben)
PMI 2.952.494 /+1,24
LHR 6.311.011 / +2,02
LGW 3.697.362 / +2,14
STN 2.164.042 /+9,36
Eine Juli-Zahl möchte ich noch "nachliefern" (soeben erst veröffentlicht), da PHL in der Weltrangliste sozusagen in erreichbarer Nähe zu MUC liegt (heuer allerdings noch unwahrscheinlich).
PHL Pax Juli 04: 2.754.420 / +14,23
Jan.-July: 16.040.849 (Vergleich MUC: 15.046.381, fehlt also rund 1,0 Mio.)
munich
Schneekönig
Und hier die August-Zahlen von 2 weiteren Kandidaten, die möglicherweise nächstes Jahr von MUC im Ranking überholt werden:
SYD: rund 2.341.000 / +12,3% | YTD 18.030.811 / +14,3%
FCO: rund 2.793.000 / +7,2% | YTD 18.684.350 / +9,15%
zusätzlich noch
SIN: rund 2.600.000 / +15,1% | YTD 19.683.013 / +31,11%
PEK: 3.554.402 / +33,90% / YTD 22.366.022 / +61,03%
Zum Vergleich!
MUC: 2.518.589 / +14,39% | YTD 17.564.970 / +10,35%
SYD: rund 2.341.000 / +12,3% | YTD 18.030.811 / +14,3%
FCO: rund 2.793.000 / +7,2% | YTD 18.684.350 / +9,15%
zusätzlich noch
SIN: rund 2.600.000 / +15,1% | YTD 19.683.013 / +31,11%
PEK: 3.554.402 / +33,90% / YTD 22.366.022 / +61,03%
Zum Vergleich!
MUC: 2.518.589 / +14,39% | YTD 17.564.970 / +10,35%
munich
Schneekönig
[quote author=munich link=board=2;threadid=788;start=135#msg15093 date=1094618986] ....
Hier die soeben erschienenen July-Pax-Zahlen Europäischer Airports...
[/quote]
Zu dem zitiertem obigem Post nun noch der Bericht von ACI-Europe:
Emile Hamon, Research Analyst, ACI EUROPE, reports
Overall passenger traffic among European airports increased +8.3% in July 2004 when compared with July 2003. Some examples of airports that experienced a significant increase in traffic, when comparing July 2004 with July 2003, include:
• Group 1 airports – Rome Fiumicino (+9.8%), London Heathrow (+7.8), and Madrid Barajas (+6.5%);
• Group 2 airports – Vienna (+17.7%), Munich (+14.5%) and Düsseldorf (+13.2%);
• Group 3 airports – Moscow Domodedovo (+31.2%), Prague (+27.4%) and Helsinki (+15.5%); and
• Group 4 airports – Girona (+69.9%), Riga (+55.0%) and Vilnius (+49.4%).
Passenger figures for July 2004 demonstrate that once again Group 4 airports (airports welcoming less than 5 million passengers per year) have the largest increase in traffic - with an average increase of +11.1% when compared with July 2003. A comparison of July 2004 and July 2002 demonstrates an average increase of 18.4%.
In July 2004, airports welcoming more than 25 million passengers per year (Group 1), airports welcoming between 10 and 25 million passengers (Group 2) and airports welcoming between 5 and 10 million passengers (Group 3) reported an average increase of +6.7%, +9.2% and +8.1% respectively when compared with July 2003. The same comparison of July 2004 with July 2002 demonstrates an average increase of +7.4%, +11.3% and +16.8% respectively.
====================================================
Na, nächstes Jahr hat's sich's dann auch was mit "Group 2 airports" für MUC! ;D Da steigen wir dann in die "Champions League" (>25 Mio.) auf!
Hier die soeben erschienenen July-Pax-Zahlen Europäischer Airports...
[/quote]
Zu dem zitiertem obigem Post nun noch der Bericht von ACI-Europe:
Issue 157: September/October 2004
European airport passenger traffic up 8.3% in JulyEmile Hamon, Research Analyst, ACI EUROPE, reports
Overall passenger traffic among European airports increased +8.3% in July 2004 when compared with July 2003. Some examples of airports that experienced a significant increase in traffic, when comparing July 2004 with July 2003, include:
• Group 1 airports – Rome Fiumicino (+9.8%), London Heathrow (+7.8), and Madrid Barajas (+6.5%);
• Group 2 airports – Vienna (+17.7%), Munich (+14.5%) and Düsseldorf (+13.2%);
• Group 3 airports – Moscow Domodedovo (+31.2%), Prague (+27.4%) and Helsinki (+15.5%); and
• Group 4 airports – Girona (+69.9%), Riga (+55.0%) and Vilnius (+49.4%).
Passenger figures for July 2004 demonstrate that once again Group 4 airports (airports welcoming less than 5 million passengers per year) have the largest increase in traffic - with an average increase of +11.1% when compared with July 2003. A comparison of July 2004 and July 2002 demonstrates an average increase of 18.4%.
In July 2004, airports welcoming more than 25 million passengers per year (Group 1), airports welcoming between 10 and 25 million passengers (Group 2) and airports welcoming between 5 and 10 million passengers (Group 3) reported an average increase of +6.7%, +9.2% and +8.1% respectively when compared with July 2003. The same comparison of July 2004 with July 2002 demonstrates an average increase of +7.4%, +11.3% and +16.8% respectively.
====================================================
Na, nächstes Jahr hat's sich's dann auch was mit "Group 2 airports" für MUC! ;D Da steigen wir dann in die "Champions League" (>25 Mio.) auf!
munich
Schneekönig
Hab soeben die Juli-Zahlen von New York erhalten. Dabei verzeichnet JFK Wachstumsraten, wie sie momentan fast nur in China bzw. Fernost erreicht werden.
JFK: 3.770.266 / +17,95% | 21.388.104 / +20,74%
EWR: 3.060.005 / +5,32% | 18.446.513 / +10,31%
LGA: 2.150.091 / +3,74% | 13.836.651 / +8,58%
NY gesamt: 8.980.362 / +9,86% | 53.671.268 / +13,76%
Hier noch die bisher bekannten Juli-Verkehrszahlen:
1 Atlanta, GA (ATL) 7.882.029 6,36
2 Chicago, IL (ORD) 7.212.960 10,41
3 London, GB (LHR) 6.518.100 8,24
4 Tokyo, JP (HND) ? ?
5 Los Angeles, CA (LAX) 5.988.269 10,99
6 Dallas/ft Worth Airport, TX (DFW) 5.677.154 19,99
7 Paris, FR (CDG) 4.891.500 5,98
8 Frankfurt, DE (FRA) 4.752.525 5,62
9 Amsterdam, NL (AMS) 4.345.060 22,10
10 Denver, CO (DEN) 4.232.906 13,50
11 New York, NY (JFK) 3.770.266 17,95
12 Las Vegas, NV (LAS) 3.699.442 13,93
13 Madrid, ES (MAD) 3.672.321 7,58
14 Phoenix, AZ (PHX) 3.591.777 4,45
15 Houston, TX (IAH) 3.572.982 4,62
16 Minneapolis/St Paul, MN (MSP) 3.526.735 26,62
17 London, GB (LGW) 3.462.100 6,28
18 Hong Kong (HKG) 3.448.000 39,48
19 Detroit, MI (DTW) 3.379.876 8,49
20 San Francisco, CA (SFO) 3.338.069 16,51
21 Bangkok, TH (BKK) 3.257.122 34,26
22 Beijing, CN (PEK) 3.174.481 60,24
23 Newark, NJ (EWR) 3.060.005 5,32
24 Seattle/Tacoma, WA (SEA) 3.028.948 5,51
25 Orlando, FL (MCO) 2.865.463 14,60
26 Miami, FL (MIA) 2.845.356 3,72
27 Tokyo, JP (NRT) 2.806.892 25,56
28 Rome, IT (FCO) 2.769.543 9,81
29 Philadelphia, PA (PHL) 2.754.420 14,23
30 Palma de Mallorca, ES (PMI) 2.728.391 10,49
31 Singapore, SG (SIN) 2.679.107 26,31
32 Toronto, OT, CA (YYZ) ? ?
33 Boston, MA (BOS) 2.489.024 14,24
34 Munich, DE (MUC) 2.448.439 14,46
35 Sydney, AU (SYD) 2.419.000 12,09
36 Barcelona, ES (BCN) 2.395.516 8,14
37 Charlotte, NC (CLT) 2.345.878 5,69
38 Paris, FR (ORY) 2.343.200 9,74
39 Manchester, GB (MAN) 2.334.800 5,84
40 Seoul Incheon, KR (ICN) 2.255.394 26,65
41 Jakarta Sukarno Hatta, ID (CGK) ? ?
42 Mexico City, MX (MEX) 2.175.951 14,41
43 Washington Dulles (IAD) 2.174.767 32,13
44 New York, NY (LGA) 2.150.091 3,74
45 Cincinnati, OH (CVG) 2.110.601 4,51
46 London, GB (STN) 2.049.451 10,13
47 Baltimore/Washington, MD (BWI) 1.898.042 -6,58
48 Mailand, IT (MXP) 1.885.352 8,86
und hier noch die Juli- YTD-Zahlen:
1 Atlanta, GA (ATL) 49.278.315 7,91
2 Chicago, IL (ORD) 43.603.998 10,63
3 London, GB (LHR) 38.772.397 9,96
4 Tokyo, JP (HND) ??? ???
5 Los Angeles, CA (LAX) 35.351.180 11,51
6 Dallas/ft Worth Airport, TX (DFW) 34.939.042 15,85
7 Paris, FR (CDG) 29.269.051 8,20
8 Frankfurt, DE (FRA) 29.055.614 7,76
9 Denver, CO (DEN) 24.948.312 15,75
10 Amsterdam, NL (AMS) 24.365.074 8,15
11 Las Vegas, NV (LAS) 24.059.387 15,03
12 Phoenix, AZ (PHX) 23.118.848 4,42
13 Madrid, ES (MAD) 21.993.864 9,77
14 Minneapolis/St Paul, MN (MSP) 21.591.922 12,28
15 New York, NY (JFK) 21.388.104 20,74
16 Houston, TX (IAH) 21.327.849 4,22
17 Bangkok, TH (BKK) 21.101.921 31,79
18 Hong Kong (HKG) 20.542.000 56,28
19 Detroit, MI (DTW) 20.346.444 7,46
20 San Francisco, CA (SFO) 19.176.396 16,69
21 Orlando, FL (MCO) 18.920.118 17,76
22 Beijing, CN (PEK) 18.811.620 67,44
23 Newark, NJ (EWR) 18.446.513 10,31
24 Miami, FL (MIA) 18.392.996 5,30
25 London, GB (LGW) 17.610.110 6,82
26 Tokyo, JP (NRT) 17.501.167 24,11
27 Singapore, SG (SIN) 17.083.013 33,95
28 Seattle/Tacoma, WA (SEA) 16.427.806 7,44
29 Toronto, OT, CA (YYZ) ??? ???
30 Philadelphia, PA (PHL) 16.040.849 13,13
31 Rome, IT (FCO) 15.891.269 9,49
32 Sydney, AU (SYD) 15.689.811 14,60
33 Munich, DE (MUC) 15.046.381 9,70
34 Boston, MA (BOS) 15.043.994 16,12
35 Jakarta, ID (CGK) ??? ???
36 Charlotte, NC (CLT) 14.426.114 8,69
37 Paris, FR (ORY) 14.037.800 9,94
38 Barcelona, ES (BCN) 13.963.961 9,19
39 New York, NY (LGA) 13.836.651 8,58
40 Seoul Incheon, KR (ICN) 13.442.939 29,93
41 Mexico City, MX (MEX) 13.161.852 8,02
42 St Louis, MO (STL) ??? ???
43 Cincinnati, OH (CVG) 12.649.517 3,85
44 Baltimore/Washington, MD (BWI) 12.469.206 8,67
45 Manchester, GB (MAN) 11.801.929 10,47
46 London, GB (STN) 11.702.460 15,85
47 Washington Dulles (IAD) 11.421.434 19,02
48 Palma de Mallorca, ES (PMI) 11.253.275 5,69
49 Mailand, IT (MXP) 10.418.789 6,54
50 Zürich, CH (ZRH) 9.826.932 2,21
51 Washington Ronald Reagan (DCA) 9.268.016 13,27
52 Düsseldorf, DE (DUS) 8.401.665 7,95
53 Vienna, AT (VIE) 8.284.882 18,70
munich
Schneekönig
Zwischen Boston und München wird es heuer ein Kopf an Kopfrennen geben, was das Ranking anbetrifft.
Muc hatte BOS im Jahr 2002 erstmals überholt und konnte dies auch letztes Jahr beibehalten.
Auch dieses Jahr konnte MUC seine Vormachtstellung bei den YTD-Zahlen bis auf den April beibehalten. Im August hat BOS MUC nun wieder überholt und liegt mit 20.584 Paxen in Front.
BOS Aug. 04: 2.541.560 / +13,81% | YTD: 17.585.554 / +15,78%
Zum Vergleich:
MUC Aug. 04: 2.518.589 / +14,39% | YTD: 17.564.970 / +10,35%
MUC dürfte allerdings im September und Oktober auf jeden Fall wieder Punkten, da BOS in diesen Monaten in den letzten Jahren immer schlechter lag.
Es dürfte aber auf jeden Fall ein spannendes Rennen werden.
Zusätzlich noch einige schon bekanntgegebene August-Zahlen:
Airp.: August 04 / Change| Jan.-Aug. 04 / Change
ATL: 7.316.552 / +2,02 | 56.594.867 / +7,11
ORD: 7.004.345 / +9,18 | 50.663.143 / +10,55
LHR: 6.311.011 / +2,02 | 45.252.067 / +8,83
LAX: 5.856.154 /+8,03 | 41.207.334 / +11,00
CDG: 4.959.300 / +2,26 | 34.228.351 / +7,30
FRA: 4.924.007 / +1,77 | 33.979.621 / +6,85
AMS: 4.253.636 / +5,10 | 28.618.710 / +7,68
DEN: 4.009.587 / +11,59 | 28.957.899 / +15,16
MAD: 3.736.518 / +6,75 | 25.730.382 / +9,32
LGW: 3.697.362 / +2,14 | 21.307.472 / +5,98
PEK: 3.554.402 / +33,90 | 22.366.022 / +61,03
HKG: 3.509.000 / +16,04 | 24.051.000 / +48,75
MSP: 3.471.861 / +10,17 | 25.063.783 / +11,99
BKK: 3.397.248 / +22,24 | 24.499.169 / +30,38
PHX: 3.373.538 / +3,62 | 26.497.197 / +4,33
SEA: 3.043.864 / +5,76 | 19.471.670 / +7,17
NRT: 2.952.827 / +13,00 | 20.453.994 / +22,38
PMI: 2.952.494 / +1,24 | 14.205.769 / +4,73
FCO: 2.793.081 / +7,26 | 18.684.350 / +9,15
MIA: 2.669.074 / -3,58 | 21.062.070 / +4,08
SIN: 2.600.000 / +15,10 | 19.683.013 / +31,11
BOS: 2.541.560 / +13,81 | 17.585.554 / +15,78
BCN: 2.523.685 / +7,35 | 16.487.646 / +8,90
MUC: 2.518.589 / +14,39 | 17.564.970 / +10,35
ICN: 2.466.727 / +13,46 | 15.909.666 / +27,07
MAN: 2.394.475 / +1,81 | 14.196.404 /+8,90
SYD: 2.341.000 / +12,33 | 18.030.811 / +14,30
IAD: 2.339.077 / +43,24 | 13.760.511 / +22,55
ORY: 2.228.400 / +4,34 | 16.266.200 / +9,14
STN: 2.164.042 / +9,36 | 13.866.502 / +14,79
CLT: 2.149.400 / +1,43 | 16.857.010 / +9,33
MEX: 2.120.751 / +11,51 | 15.282.603 / +8,49
MXP: 2.104.133 /+1,61 | 12.522.922 / +5,68
CVG: 2.021.255 / 3,18 | 14.670.772 / +3,76
MDW: 1.884.397 / 8,21 | 13.626.417 / +8,88
CPH: 1.747.341 / +3,93 | 12.813.110 / +8,15
ZRH: 1.664.392 / -3,54 | 11.491.324 / +1,33
BRU: 1.633.700 / +2,11 | 10.523.739 / +2,96
DUS: 1.585.991 / +2,66 | 9.987.656 /+7,07
VIE: 1.489.808 / +13,97 | 9.774.690 / +17,96
DCA: 1.335.571 / +9,77 | 10.603.587 / +12,82
PRG: 1.068.476 / +22,68 | 6.323.067 / +32,24
TXL: 926.819 / -3,94 | 7.217.158 / -0,68
HAJ: 560.885 / -2,38 | 3.464.660 / +4,45
SXF: 390.468 / +87,65 | 2.056.114 / +92,70
HHN: 274.110 / +11,20 | 1.835.971 / +18,74
THF: 33.640 / +7,61 | 290.768 / -4,92
munich
Schneekönig
ACI August-Zahlen Europäischer Airports wurden soeben herausgegeben.
Paris CDG baut seinen Vorsprung gegenüber FRA gerinfügig (rund 35.300 Paxe) weiter aus und liegt nun bei den YTD-Zahlen um rund mit 276.000 Paxen in Front.
Paris ORY verliert gegenüber MUC weiterhin an Boden (rund 290.190), so dass ORY bei den YTD-Zahlen bis August nun schon rund um 1,3 Mio. Paxen hinten liegt. Bei den Sept.-Zahlen von MUC dürfte ORY nun endgültig kein Gegner mehr sein.
DUS (9.987.700) liefert sich ein Kopf- an Kopfrennen mit OSL 9.971.500) und VIE (9.774.700).
Interessant ist auch das enorme Wachstum von Moskau DME (8.242.000 / +39.1%). Bei dem Wachstum dürfte DME nächstes Jahr ein echter Konkurrent von DUS in der Weltrangliste werden.


munich
Schneekönig
MUC scheint nach DEN auch im Visier von DFW für kommendes Jahr zu sein, wie ich in diesem Wettbewerbsplan des DFW-Airports (S. 42-44) gerade gesehen habe (Siehe auch angehängte Graphik).
(PS. Habe bei dieser Gelegenheit die Juli- und Aug.-Zahlen auf S. 10 dieses Threads "geupdated"")
2) Target Markets Domestic and international markets that have been targeted by DFW for the coming year are summarized in Exhibits 9.2 and 9.3, respectively.
(PS. Habe bei dieser Gelegenheit die Juli- und Aug.-Zahlen auf S. 10 dieses Threads "geupdated"
2) Target Markets Domestic and international markets that have been targeted by DFW for the coming year are summarized in Exhibits 9.2 and 9.3, respectively.
Anhänge
")
munich
Schneekönig
Seh' ich auch so mit CO und DL. JFK bzw. EWR ist durch den LH-Schachzug mit dem Biz-Jet im High-Yield-Bereich abgesaugt. Deswegen no chance für andere Carrier. Wenn in dieser Richtung was passiert, dann durch LH selbst - entweder größeres Gerät nach JFK oder den Biz-737 ersetzt durch A343.
Bezügl. DFW war ich allerdings schon etwas erstaunt, weil bisher auch gerüchteweise nichts davon zu hören war.
Allerdings sind es auch 2 verschiedene Stiefel - einmal der Wunsch eines Airports, dass ein Ziel angeflogen wird und andererseits eben, ob sich ein Carrier findet.
Wobei auch nach meiner Meinung MUC bei dem Wachstum für AA durchaus interessant sein könnte. Und DFW ist immerhin in der Weltrangliste paxmäßig an 6. Stelle, wenn man so will aber mit seinen Interkontanbindungen recht bescheiden repräsentiert.
Bin echt mal gespannt, ob in nächster Zeit was zu erwarten ist.